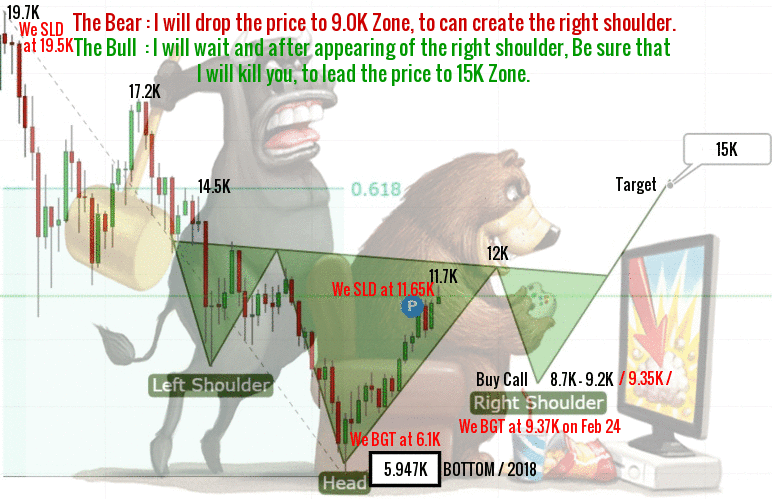
Time: 1.10 P.M. / GM+2 / 27th Feb, 2018 – Tues.
The market is working on "Bullish VOB".

To conclude:
The above pattern on the weeky chart and the below reverse H&S pattern on the daily chart, confirm the climb, toward 15K.

Bitcoin is currently trading around 10.66K at time of writing and the trend for the rest of day is bullish, supported by:
- SMA.
- Stochastic.
- RSI.
Note; What really boosted bitcoin price was the news that cross-border currency exchange company circle acquired Poloniex.
Support : 9500.00 level (Major).
Resistance : 11000.00 level (Major).
Expected trading for the rest of day:
is between 9500.00 support and 11000.00 resistance.
Expected trend for the rest of day :
Bullish.
Medium Term:
Bullish.
Long Term:
Bullish.
The low of 2018:
5947.00 / IHS Bottom.
The high of 2018:
25000.00 level / Expected.
