
Time: 8.06 A.M. / GM+2 / 2nd Mar, 2018 – Fri.
In our previous post / 513 / we had forecast the trading range will be between 10.30K and 11.50K, and the intraday high was 11.17K, close to 12K as we wrote yesterday: "Most likely the price will move from here to break 10.70K again, to open the way toward 11.2K."
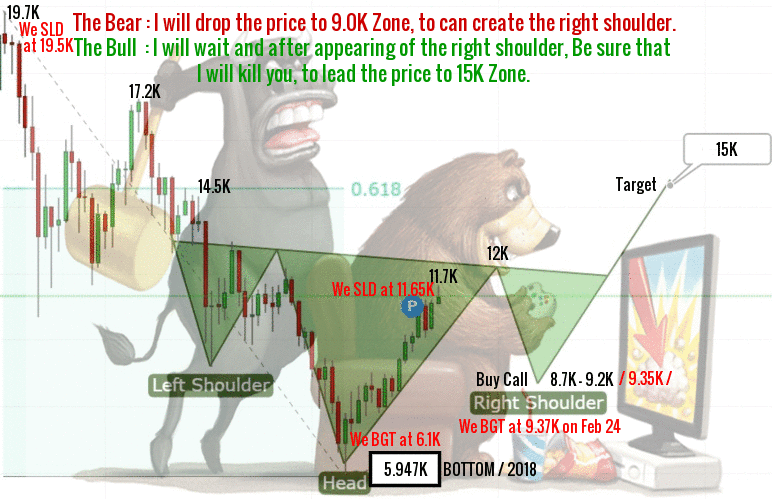
Bitcoin price breached 10.7K level again and settled above it, and the bulls close the price above the 50 SMA for the first time in a long 50 days. Price has also crossed up above the Zero line on The MACD and has closed slightly positive. It is a victory for bulls, and the bearish momentum has for now completely evaporated.
EMA50 support the bullish wave, trying to push the price to breakout 12K
( 50% Fib extension ), that will complete the inverted head and shoulders pattern on the above chart to push the price toward 12.8K
( 61.8% Fib extension ), 13.7K ( 76.4% Fib extension ) to hit finally the full extension at 15.1K before the end of March.
Bitcoin is currently trading around 10.90K at time of writing and the trend for today is bullish, supported by EMA50.
The zone 10.5-10.7K represents a significant price range that bulls would like to see holding its ground.
Technically, bitcoin looks set for another attempt to regain the 11.2K level which keeps bulls in control since February 21st, as we expected. Proper bullish conditions in the shorter timeframes / Up to 4H / will try to push the price to 11.25K and 11.65K.
Support : 10500.00 level (Major).
Resistance : 12000.00 level (Major).
Expected trading for today:
is between 10500.00 support and 12000.00 resistance.
Expected trend for today :
Bullish.
Medium Term:
Bullish.
Long Term:
Bullish.
The low of 2018:
5947.00 / IHS Bottom.
The high of 2018:
25000.00 level / Expected.
