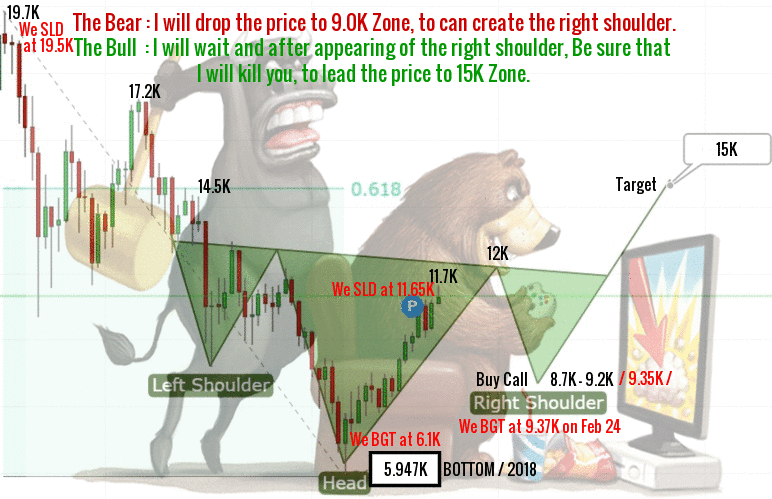
Time: 8.18 A.M. / GM+2 / 5th Mar, 2018 – Mon.
In our previous post / 516 / we had forecast the trading range will be between 10.50K and 12K, the intraday high was 11.6K, so bitcoin price still not able to breach 11.791K. Technical analysis is showing a superbull near future but volume is ridiculous.

We did draw the above chart on Feb 21, and we still believe the inverted head and shoulders pattern, will be able to push the price toward 12.8K, 13.7K to hit finally 15K before the end of march.
The last week, the price formed an intermediate low around the 10.15K and moved higher, the most important thing is that the price is placed well above it.
A strong low trading margin and consolidation phase continues. Still a test of 11.791K is pending which will be a decisive long position.
A rejection at 11.791K would bring a small correction, that might lead the price to re-test 10.5K-10.8K range.

Bitcoin is currently trading around 11.55K at time of writing and the price remains in an uptrend for today, supported by 4-hours MACD, stochastic and the EMA50 positivity.
Trading volume is the big issue that affect the bitcoin price right now. But I believe, the lower bitcoin trading volume could simply mean that the market has matured and stabilized, and if bitcoin price hit 11.791K followed by 12.8K, trading volumes could recover.
Support : 10700.00 level (Major).
Resistance : 12800.00 level (Major).
Expected trading for today:
is between 10700.00 support and 12800.00 resistance.
Expected trend for today :
Bullish.
Medium Term:
Bullish.
Long Term:
Bullish.
The low of 2018:
5947.00 / IHS Bottom.
The high of 2018:
25000.00 level / Expected.
