Time: 8.10 A.M. / GM+2 / 7th Mar, 2018 – Wed.
In our previous post / 518 / we had forecast the trading range will be between 10.70K and 12.80K, the intraday high was 11.33K, and the low was 10.56K. The oversupply becomes more evident when noticing that it’s at the same price level as the prior peak of 11.791K posted on Feb 20, the reason why we predict in our last post:
"A rejection at 11.791K would bring a small correction, that might lead the price to re-test 10.5K-10.7K range".

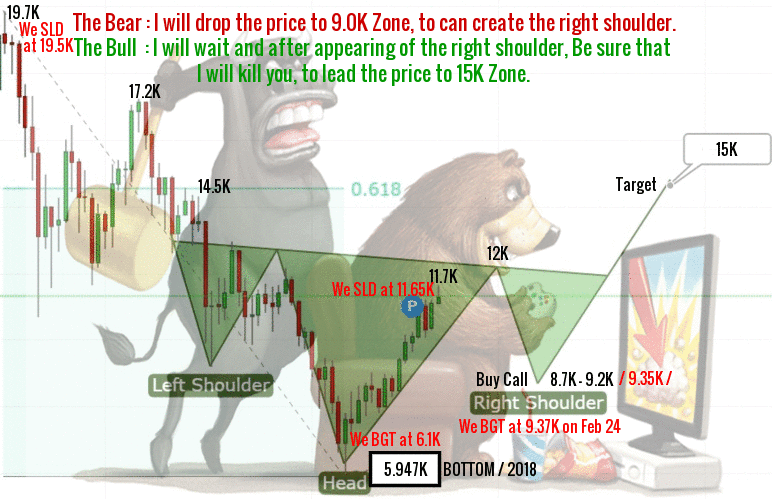
Due to the low volume, bitcoin price run out of steam and was not able to break 11.971K. But we still believe the inverted head and shoulders pattern ( We did draw the above chart on Feb 21 ), will be able to push the price toward 12.8K, 13.7K to hit finally 15K before the end of march.
Important factor that could increase the volume and revive the rally might be more updates on launching an ETF.
Another drop to nearby support at 10K is expected and could create a double top pattern and in the same time EMA50 try to protect the price from more decline.
Bitcoin is currently trading around 10.65K at time of writing and the bullish trend is valid for today, conditioned by stability above 10K, that hold as a floor, supported by stochastic move, EMA50 and SMA / 100 SMA is above 200 SMA - most likely the uptrend will resume/.
Shifting risk sentiment has allowed the price of bitcoin to regain some of its safe-haven status, but traders are still on edge, waiting the price hit 11.791K and move above it. As above thie level, buyers will get back in and will be ready to push bitcoin price ( trading volumes could recover ) to the next upside 12.20K followed by 12.80K.
Support : 10000.00 level (Major).
Resistance : 11700.00 level (Major).
Expected trading for today:
is between 10000.00 support and 11700.00 resistance.
Expected trend for today :
Bullish.
Medium Term:
Bullish.
Long Term:
Bullish.
The low of 2018:
5947.00 / IHS Bottom.
The high of 2018:
25000.00 level / Expected.
