
Counterparty has broken out of the triangle pattern in the four-hour chart.
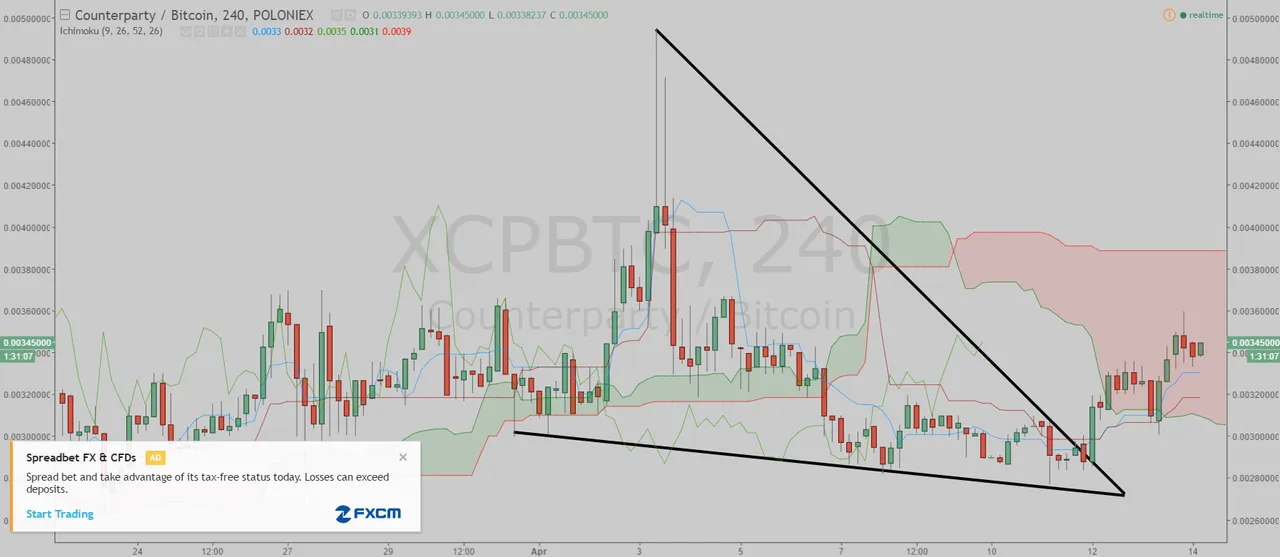
(Chart courtesy of Tradingview.com)
In Elliott Wave terms, Counterparty began a wave one advance on March 3. The wave one finished on April 3, and the wave two correction ended on April 11. If this wave count is correct, Counterparty should be heading next towards the April 3 peak in the wave three.
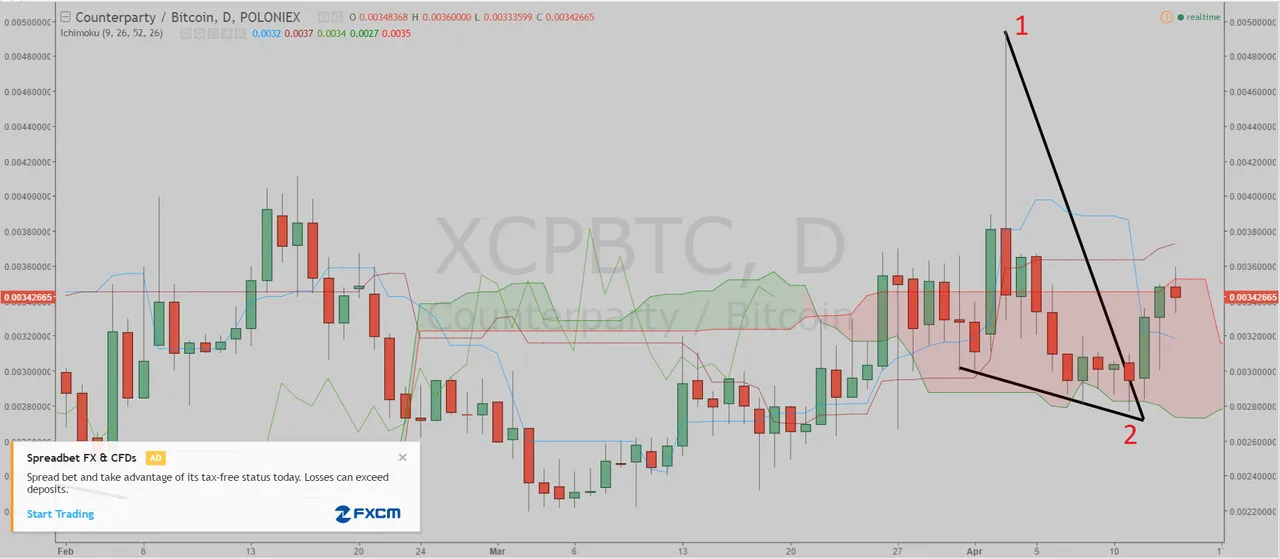
(Chart courtesy of Tradingview.com)
Zooming out in the daily chart, I believe Counterparty is currently in the wave three (sub-wave iii). The wave one began in December 2016, and finished on January 29 this year. The wave two correction ended on March 3.
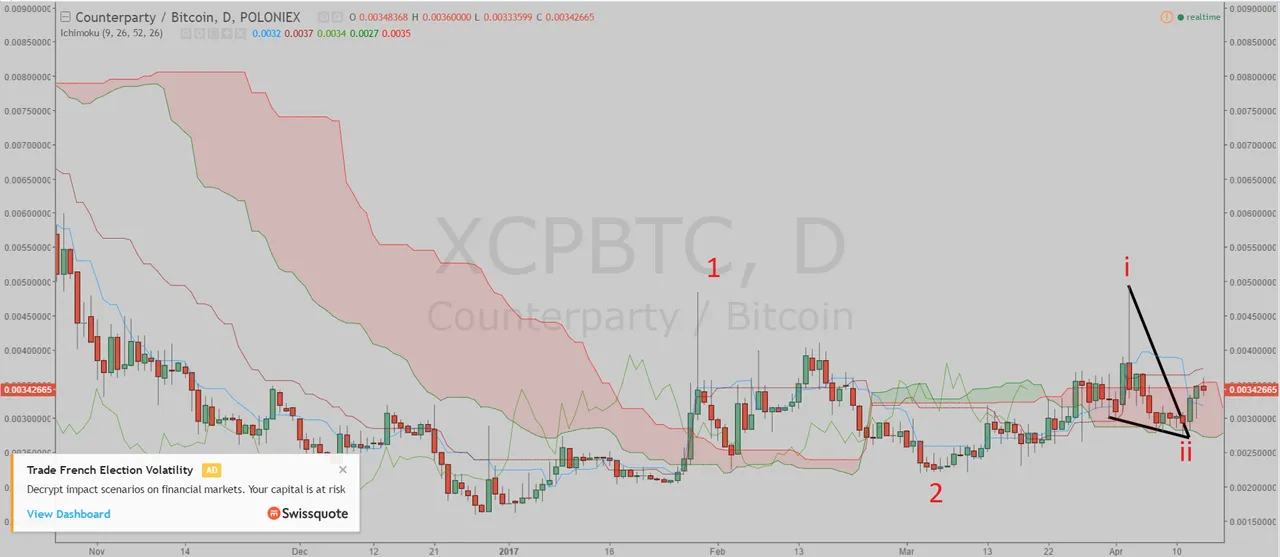
(Chart courtesy of Tradingview.com)
You can find my longer term analysis on Counterparty from here:
@maarnio/crypto-contest-january-6-counterparty

If you think this analysis is correct, upvote this post and upvote the comment "Counterparty will takeout the April 3 peak".
If you think this analysis is wrong, upvote this post and upvote the comment "Counterparty will drop below the April 11 low".
If you think Counterparty is in a range, upvote this post and upvote the comment "Counterparty will stay in a trading range between the March 3 low and the April 3 peak until May 9".
You can upvote the comment until 3 PM EST April 15 and you can upvote only one comment. 200% of Steem from this post will be distributed equally to the winners. The winners will be determined by the price action (which one happens first). Only participants with a Reputation of 35 or more will qualify in the contest.