Hi Everyone,
I have a soft spot for cost benefit analysis (CBA) as I have spent many years working in that area. I have evaluated around 100 projects/programs using CBA and I have written many conference and journal articles on CBA. Today, I just want to write a short post briefly explaining the basic concepts of CBA. I have several other material that goes into significantly more detail into specific areas of CBA. I will leave the links to these posts, videos, and articles at the end of this post.
What is costs benefit analysis?
Cost benefit analysis (CBA) is technique for comparing the benefits and costs of proposed initiatives such as policies, projects, or programs. CBA considers the benefits and costs over the lifetime of the proposed initiatives.
Why is CBA used?
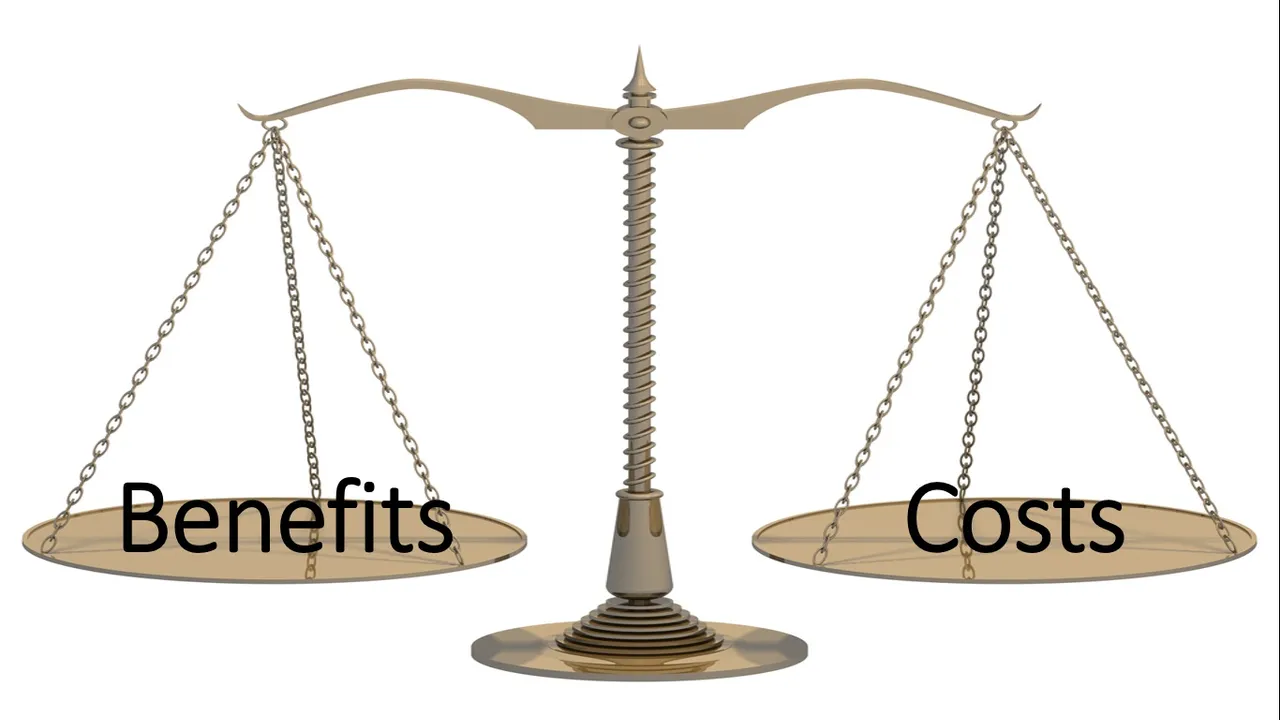
CBA is used to inform decision makers of the viability of proposed options to solve a defined problem. CBA, if conducted correctly, provides a consistent approach to valuing benefits and costs. This consistency makes it possible to compare different options as well as compare different initiatives. CBA is also well recognised, most decision-makers are familiar with the outputs produced by a CBA.

Basic steps for conducting a CBA
- Define the problem
- Define the base case
- Define the project case/s
- Identify benefits and costs
- Determine the referent group/s
- Determine key drivers of identified benefits and costs
- Formulate assumptions to enable quantification of benefits and costs
- Quantify benefits and costs
- Assign monetary value to identified benefits and costs
- Discount monetised benefits and costs
- Compare discounted benefits and costs
- Calculate economic measures and indicators
- Conduct sensitive analysis
- Report the results of the CBA
Define the problem
A proposed initiative is generally required to solve a problem. That problem needs to defined and understood. This could be an existing problem or an expected future problem. Understanding the problem is essential to shaping the solution or just simply removing the problem.

Define the base case
The base case is the world without the initiative. The base case includes both the present state of the world as well as the future state of the world across the life of the initiative. For example, what is likely to happen in 10 years if an initiative goes ahead?
The base case needs to be realistic. For example, the base case should be a state of the world which is serviceable in the absence of an immediate proposed imitative. It is likely that the base case will require some forms of low cost initiatives to maintain serviceability.
The base case is also the yardstick that all benefits and costs are compared against. A benefit or a cost is only relative to the existing values. For example operating costs are $10,000 after the initiative is put in place. If operating costs were $15,000 before the initiative, then there is a cost savings of $5,000. If the operating costs were $2,000 before the initiative, then there is an increase in costs of $8,000. We only know these savings or cost increases if we have a cost in the base case to compare against.

Define the project case/s
The project case/s is the world with the project initiatives. The project case/s includes both the present state of the world as well as the future state of the world across the life of the initiative. For example, what is likely to happen in 15 years with various initiative/s in place? The project case/s can be individual projects/options or combinations of projects/options to form a program of works.

Identify benefits and costs
Benefits and costs arise because of the proposed changes. Some of these changes will be beneficial some of them will not be.
Costs usually come in the form of initial investment costs (capital costs) to the agency and operating costs to the operators or agency. For initiates that are upgrades, it is possible that there will be operating cost savings rather than additional operating costs. Operating costs (savings) are sometimes classified as benefits to the project. Therefore, the only costs of the project are the initial investment costs.
Benefits come in the form of cost savings to users and operators, benefits to users, and external benefits. Benefits are typically viewed as positive but some benefits categories could be negative. A negative benefit is a disbenefit. It is important to identify the difference between a cost and a disbenefit. A cost is an intentional outgoing that is intended to create a benefit. A disbenefit is a negative outcome caused by the initiative. Damage to the environment is a common disbenefit of a project.

Determine referent group/s
The referent group/s are those affected by the project. An analyst has to decide who should be included in the referent group/s. The agency investing in the initiative, the users and operators are typically included in the referent group/s. The referent group can be extended to include those indirectly affected by the initiative. The referent group/s can be extended to include those in different geographical areas but could change their preferences because of the imitative. For example, a new hospital built in Town A could attract people from Town B, which is located 60km away, to use their new services. Determining the correct referent group/s is essential to capturing all benefits and costs of an initiative. It also helps establish the relationship change between those in the referent group/s.

Determine key drivers of identified benefits and costs
What are the key drives of benefits and costs? Key drivers are important events that cause benefits and costs to increase or decrease. Examples of key drivers are as follows:
- Scope of the initiative
- Population growth rates
- Income
- Other initiatives
- Weather
- Existing infrastructure
- Legislation
- Changes in demographics
- Culture
- Public perceptions
Some key drivers are within the control of those making the investment such as scope of investment. Some key drivers can be influenced by those making the investment such as legislation or public perceptions. Some key drivers are out of control of those making the decisions such as population growth and culture. Key drivers that can be controlled will become variables in the CBA, while key drivers outside of control will contribute to determining parameters for the CBA.

Formulate assumptions to enable quantification of benefits and costs
Assumptions are required when complete information is not available. Complete information is never available for a CBA. An analyst needs to determine what is known and what is not known. At this point the base case and project case/s should be defined. The referent group/s are defined. Benefits and costs are defined and the key drivers behind them are defined.
An analyst typically will not know the extent the key drivers will affect benefits and costs for each referent group. Assumptions are required to establish these relationships. Data is collected to inform these assumptions. For example population growth could be a key driver of car usage. Data can be used to determine a correlation between population growth and number of cars on the road.

Assumptions are required to determine future trends in key drivers. The use of historical data is one method of predicting future trends.
Quantify benefits and costs
Collected data combined with the use of assumptions can be used to quantify benefits and costs. Investment costs can typically be quantified directly as a monetary value. Benefits are rarely initially quantified as a monetary value. Benefits are quantified in various different units. Savings in time is quantified in minutes or hours or even days. Accidents are quantified in number of lives lost. Air pollution is quantified in volumes of pollutant gas emitted. Vehicle operating costs are quantified in fuel consumed.

Assign monetary value to identified benefits and costs
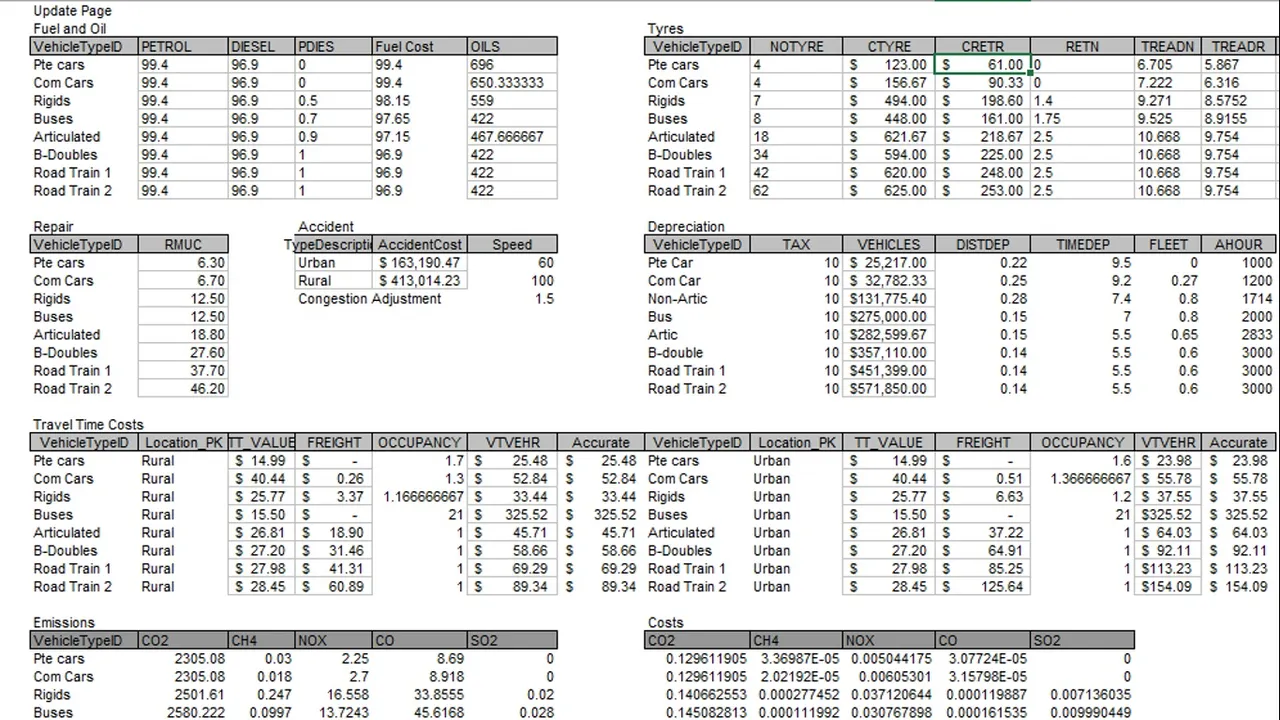
Assigning monetary value to benefits and costs is one of the most subjective aspects of a CBA. For transport CBA, extensive research has been done to establish standardised unit values to apply to units of a benefit to convert into a monetary value. There are unit values assigned to human life, injuries, time, emissions, water pollution, fuel consumption and several other benefit/disbenefit categories. Once a monetary value has been placed on a unit of a particular benefit, that value is multiplied by the number of units quantified. For example, if journey takes 5 hours and the assigned unit value of time is $10. The cost of the 5 hour journey is $50.
Discount monetised benefits and costs
Once a monetary value has been placed on each benefit and cost category for each referent group, discounting is required. Discounting is used to convert future values into present day values. A dollar spent or received in the future is worth less than a dollar spent or received now. If money is received now it can be invested to make a return. If money is received a year from now, one year of return from that money is not obtained. At an interest rate of 10% a $1 received now is worth $1.10 in one year ($1.1 is greater than $1). Using the interest rate as the discount rate, the present value of the $1 received in a year is $0.91 (1/1.1) and not $1.
Discount rates are generally determined by the funding body and are standardised across all projects funded by that body. There are several methods of calculating the discount rate. This goes beyond the scope of this simple introduction to CBA.
It is also important to note that real discount rates are used in a CBA rather than nominal discount rates. Real discount rates excludes the effect of inflation on prices. A CBA is conducted using a constant price year (prices do not change during the evaluation). The real discount rate is calculated using the following formula.
Real Discount Rate = ((1+nominal discount rate)/(1+inflation rate))-1
Compare discounted benefits and costs
After benefits and costs have been monetised and discounted for both the base case and the project case/s. they are compared with each other to determine the project/option benefits and costs. If a benefit is higher in the project case than the base case, it is a net benefit for the project/option. If it is lower, it is a net disbenefit. If a cost is higher in the project case than the base case, it is a net cost for the project/option. If it is lower, it is a net cost saving. Net benefits, net disbenefits, costs, and cost savings for each referent should recorded and documented.

Calculate economic measures and indicators
There are a number of economic indicators and measures to determine the economic viability of an initiative.
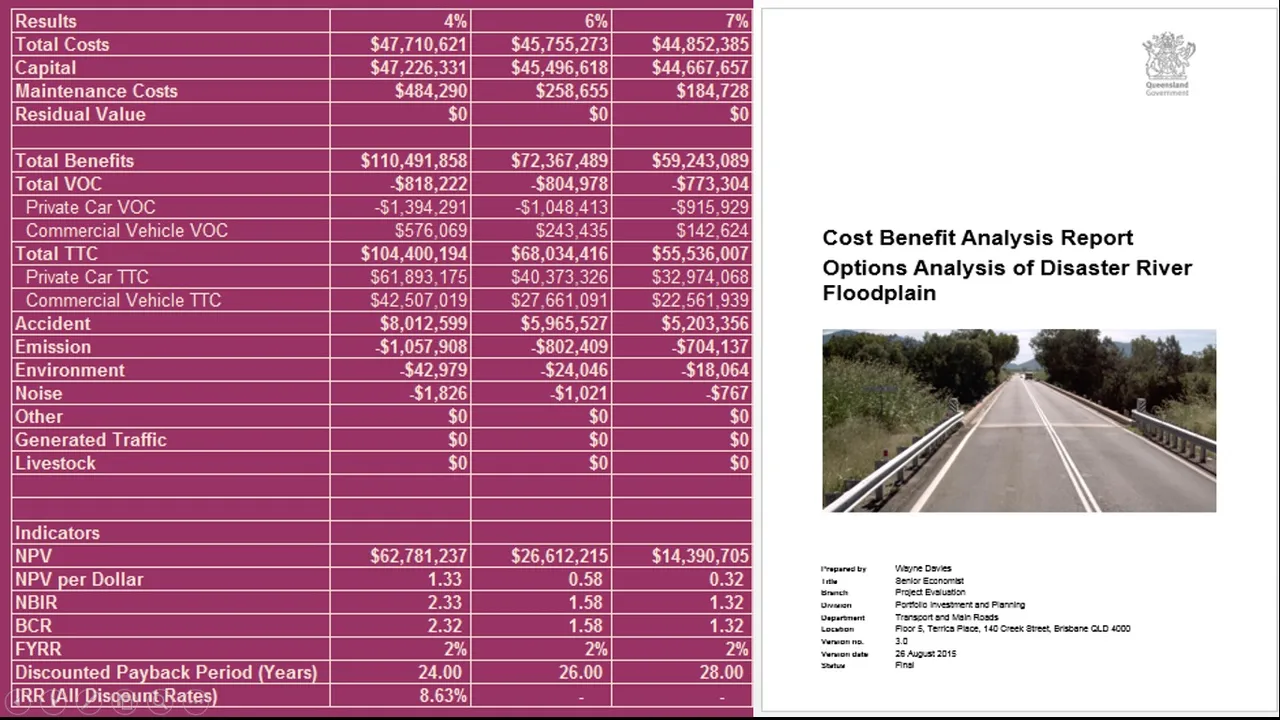
The most common is the net present value (NPV). The NPV is the sum of all discounted benefits, cost savings, disbenefits, and costs. If the value of the NPV is greater than zero the project is economically viable. If options are being compared, the option with the highest NPV is selected.
Another common indicator is the benefit cost ratio (BCR). The BCR is benefits (includes disbenefits) divided by costs (includes cost savings to the agency). If the BCR is great than one, the project is economically viable. The BCR has several limitations. It cannot be used for comparing options (mutually exclusive options). The results can be misleading when there are very high cost savings (if costs savings exceed initial investment costs, the BCR will be negative).
A superior but less commonly used indicator is the net benefit investment ratio (NBIR). The NBIR is net benefits (includes benefits, disbenefits, and cost savings) divided by initial investment costs or capital costs. The NBIR is more consistent and does not have the problem with producing negative values. For options analysis, an incremental net benefit investment ratio (INBIR) can be calculated. The INBIR is the difference between the net benefits of two options divided by the difference in investment costs between the two options. If the incremental net benefits of the option with higher investment cost is greater than the incremental increase in investment cost, the higher cost option is preferred.

Conduct sensitive analysis
The key drivers of the benefits and costs of the initiative are revisited. The assumptions applied to the key drivers in the initial CBA are adjusted both higher and lower to determine the impact on the results of the CBA. For example, the CBA can be recalculated using a population growth rate of 6% instead of 4%.
The different sensitivity tests should produce a range of results for the CBA. These results can be presented in a simple table showing the maximum and minimum NPV. They can also be presented as a distribution of results. A probability can be assigned to the likelihood of each result produced using different key drivers and parameters.

Report the results of the CBA
To conclude a CBA, the results are normally included in a report. The report will describe all the steps described above and how they were applied to the CBA. The report will contain all references to sources of information as well as the data inputs and parameters used in the CBA. The report should also contain information regarding the model that was used to conduct the CBA as well as any outputs from other models used in the CBA. The results should be presented clearly in the report. Benefits should be broken down by category. Annual flow of benefits and costs should also be included in the report, possibly as an appendix.
An indication of a quality CBA report is the ease of replication of the analysis by a reviewer. The report should contain everything a reviewer requires to replicate the analysis. If the analysis cannot be replicated by the reviewer. The report can be considered inadequate.
Conclusion
This post covers the basics to conducting a CBA. It should not be considered a guide but rather just basic information for understanding how a CBA should be conducted.
I would to thank you for spending the time to read this post. I will have more posts relating to CBA in the coming weeks. These posts will look at how the principles of CBA can be applied in our lives rather than just for major initiatives.
Additional Information on CBA.
These posts contain videos of me explaining certain aspects of CBA.
Integrating CBA and Social Impact Evaluation
@spectrumecons/integrating-social-impact-evaluation-with-cost-benefit-analysis
CBA Sensitivity Analysis
@spectrumecons/cost-benefit-analysis-sensitivity-analysis
CBA Decision Criteria
@spectrumecons/cost-benefit-analysis-criteria-for-decision-making
CBA Assumptions
@spectrumecons/cost-benefit-analysis-assumptions
CBA Discount Rate
@spectrumecons/cost-benefit-analysis-discount-rate
CBA Video
@spectrumecons/cost-benefit-analysis-video
You can access my journal articles with google scholar using the following link:
https://scholar.google.com.au/citations?user=VY-pskAAAAAJ&hl=en


