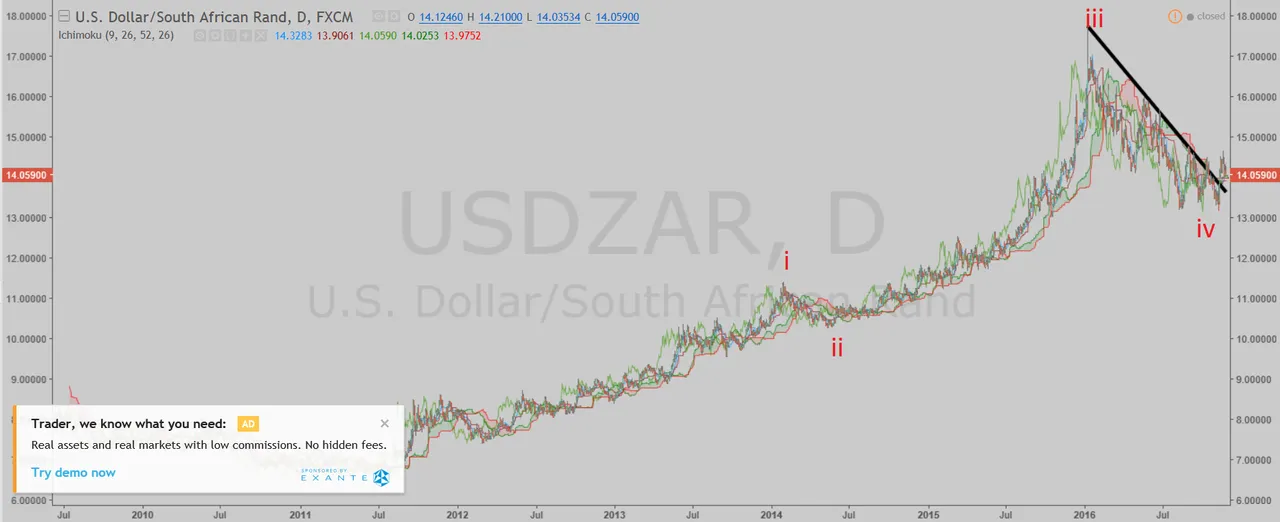
U.S. Dollar / South African Rand (USD/ZAR) has broken the trend line drawn from the January 11 peak.

(Chart courtesy of Tradingview.com)
In Elliott Wave terms, I believe USD/ZAR is currently in the wave five in the daily chart. The wave one started in the March 2012, and ended in the January 2014. The wave two correction finished in the May 2014, and the wave three advance ended on the January 11. The wave four correction finished on the November 8. If this wave count is correct, USD/ZAR should be heading next towards the January 11 peak.
(Chart courtesy of Tradingview.com)
In the weekly chart, USD/ZAR is currently most likely in the wave three (sub-wave v). The wave one started in the April 2011, and finished in the November 2011. The wave two correction ended in the March 2012.

(Chart courtesy of Tradingview.com)
In the monthly chart, I believe USD/ZAR is in the wave three. The wave one finished in the October 2008, and the wave two correction ended in the April 2011.

(Chart courtesy of Tradingview.com)
Disclosure: I am/we are long USD/ZAR.

If you think this analysis is correct, upvote this post and upvote the comment "USD/ZAR will takeout the January 11 peak".
If you think this analysis is wrong, upvote this post and upvote the comment "USD/ZAR will drop below the November 8 low".
You can upvote the comment until 3 PM EST November 27 and you can upvote only one comment. 100% of Steem (2.559 STEEM) from this post will be distributed equally to the winners. The winners will be determined by the price action (which one happens first).

Forex Contest November 26: USD/ZAR
9 years ago
in#forex
8 Comments