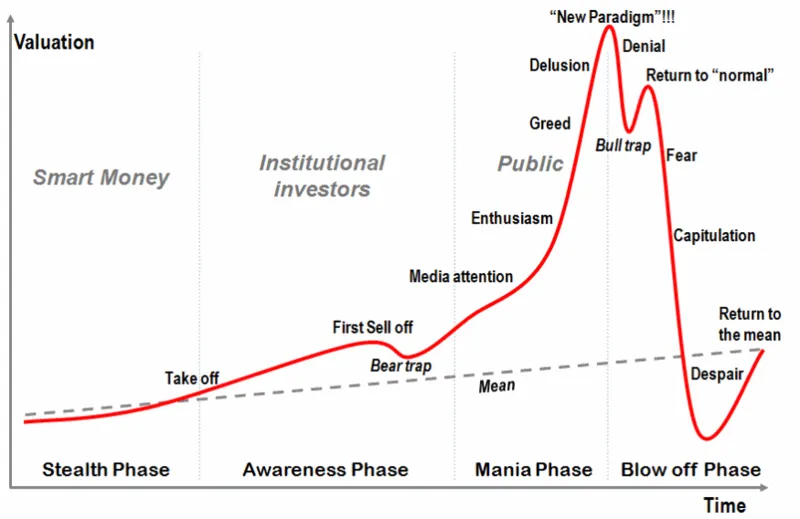
So @sacred-agent turned me onto a Technical analysis approach called Hyperwaves. It takes the standard guideline for how bubbles works, and adds some more details to the rules.
Hyperwaves
You can find more information on hyperwaves here
General Guideline for Bubbles

This is what a standard bubble looks like!
Now let's layer on the Hyperwaves map (if it's red the price stays below if it's green the price stays above)

The last thing I wanted to mention was bitconnect- What may be the first hyperwave in crypto!

Here's the price chart for Bitconnect. Pretty easy to spot the match to the general bubble guideline
Ok, so, now I've put in the numbers that corruspond to Hyperwaves.

You can see a pretty standard map for lines 1-7 that fairly accurately call most of the touch points for bitconnect. It didn't seem to have a common touch point between lines/stages 2&3. So, that makes that piece a little tricky to spot as it's going, but otherwise you can see all of the stages and they look to align with the bubble chart and the more specific guidelines of hyperwaves.
Timing
What's fascinating is that timing of these things is usually in the decade length of time, but here we're seeing bitconnect run that in under two years. That also goes well with what JP Morgan guys just said of "cryptocurrencies are moving like the Nasdaq back in the 90s, but about 15 times faster!"
So, why do I care about a completed one?
It shows that these bubbles can take place in under 2 years. It's a guidepost relative to stocks where they can take 10-30 years, and there's one in bonds going on for over 50 years right now.
What do I do with this info?
You look at things that seem to be in bubbles and then make some better guesses knowing some guidelines of how these prices tend to move while in a bubble; namely, they stay under line 1, over line 2,3,4, under line 5, over line 6, and under line 7. If it's following the general guidelines you now have a good idea of when to call tops and bottoms because it breaks the line.
TA is tea leaves?
Some people think this is all reading tea leaves. That's ok. This approach might not be for everyone. I'm also not an expert. I'm learning this as I'm going. So, don't take my word as gospel here, but I wanted to share some of what I'm seeing from people that have done this for 40+ years. Currently I don't think it's tea leaves, and secondly I think bitcoin is still in a hyperwave (stage 3). Hopefully, this informs you with an extra idea of how to trade bubbles in general and give you a sense of how long a bubble might last in this market.
This isn't meant to tell you to buy or sell, but is one potential thought in the Technical Analysis sphere that may provide informational incite for you to make better decisions on your own.