
S&P 500 | Historical Data For April 7th
April 11, 2017 | SPYTRADER
https://www.spytrader.net/single-post/2017/04/12/SP-500-Historical-Data-For-April-13th
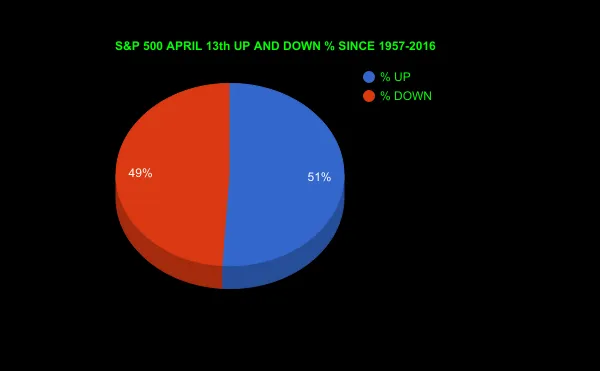
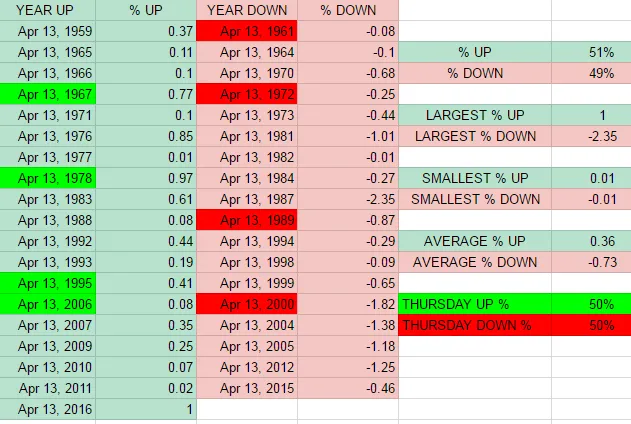
Above you will see every year the S&P 500 has traded on the 13th of April since 1957. There have been 39 years this has happened and out of those 39 years it has been up 51% of the time and down 49% , and two unchanged.
The largest percent up was April 13th 2016 with a 1.00% move up , and the largest percent down was April 13th 1987 with a -2.35% move down.
The smallest percent up was April 13th 1977 with a move up of .01% , and the smallest percent down was April 13th 1982 with a -.01%.
The average percentage move up was .36% and the average percentage move down was -.73%.
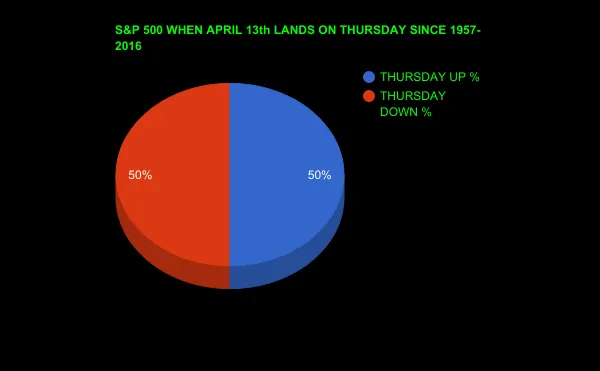
Lets take a deeper look. Since 1957 April 13th has landed on a Wednesday 8 times and out of those 8 times 4 have been up days, that is 50%
SOURCE FOR EVERYTHING IN THIS POST IS FROM https://www.spytrader.net/
I have permission from https://www.spytrader.net/ to post this.