Time: 8.18 A.M. / GM+2 / 8th Mar, 2018 – Thurs.
In our previous post / 519 / we had forecast the trading range will be between 10K and 11.70K, the intraday high was 10.8K, and the low was 9.4K, due to a rejection at 11.791K.

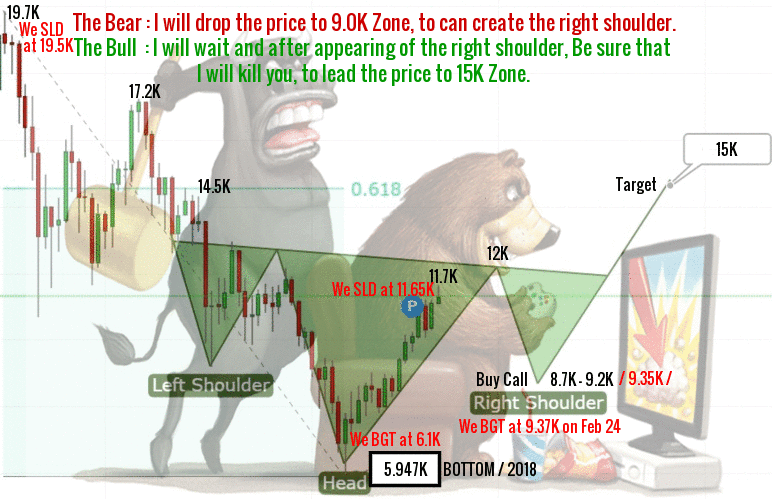
Bitcoin price traded with negativity, breaking 10.7K and settles below it. More decline toward 9.4K - 8.7K is expected, due to the low volume. But as the price is above 8.7K, the trend is slighty bullish and we still believe the inverted head and shoulders pattern ( We did draw the above chart on Feb 21 ), have a big chance to push the price toward 12.8K, 13.7K to hit finally 15K before the end of march.
Bears fighting but the trend is still slighty bullish. Technical indicators suggest a potential pickup:
- Option 1 / The price will re-test 8.7K before any new attempt to rise again.
- Option 2 / The price could still bounce from 9.4K to re-visit 11.791K.
Bitcoin is currently trading around 9.75K at time of writing and the trend is slighty bullish for today, conditioned by stability above 8.7K. The reason why I come up with the above 2 options as I believe a strong bullish momentum might lead to continuation of bull run.

Support : 8700.00 level (Major).
Resistance : 10700.00 level (Major).
Expected trading for today:
is between 8700.00 support and 10700.00 resistance.
Expected trend for today :
Slighty Bullish.
Medium Term:
Bullish.
Long Term:
Bullish.
The low of 2018:
5947.00 / IHS Bottom.
The high of 2018:
25000.00 level / Expected.
