Time: 8.00 A.M. / GM+2 / 9th Mar, 2018 – Fri.
In our previous post / 520 / we had forecast the trading range will be between 8.70K and 10.70K, the intraday high was 10.10K, and the low was 8.80K. BTC/USD can drop towards 8.50K- 8.00K zone and there turn higher, as technical indicators, are suggesting that bullish momentum is still present.

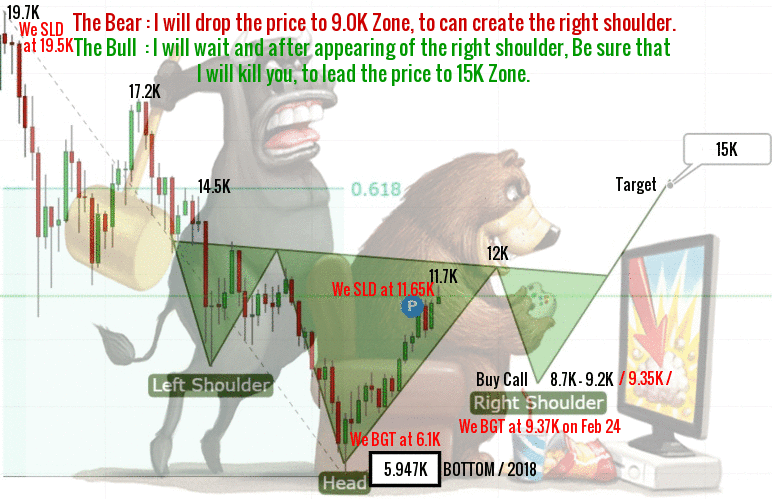
Bitcoin price traded with negativity, breaking 9.20K and settles below it. More decline toward 8.50K - 8.00K is expected. But as the price still above 8.00K, the trend is slighty bullish and we still believe the inverted head and shoulders pattern ( We did draw the above chart on Feb 21 ), have a big chance to push the price toward 12.8K, 13.7K to hit finally 15K before the end of march.
Note; Clear break of 8.00K will cancel the bullish run and the above inverted head and shoulders pattern to lead the price towards 6.10K.
Bitcoin is currently trading around 8.60K at time of writing and the trend is slighty bullish for today, conditioned by stability above 8.00K, and supported by technical indicators, that suggest the bullish momentum is still present. The reason why I believe the price will visit the 8.50K- 8.00K zone today and will turn up ( strong rejection to the upside).
Support : 8000.00 level (Major).
Resistance : 9700.00 level (Major).
Expected trading for today:
is between 8000.00 support and 9700.00 resistance.
Expected trend for today :
Slighty Bullish.
Medium Term:
Bullish.
Long Term:
Bullish.
The low of 2018:
5947.00 / IHS Bottom.
The high of 2018:
25000.00 level / Expected.
