
Here I am with my latest Visually Explained! series. This time we will continue from my Shannon Entropy article. As I mentioned in past, my focus of these Visually Explained! articles are "Less Math and More Intuition".
Shannon Entropy is not a measure of disorder!
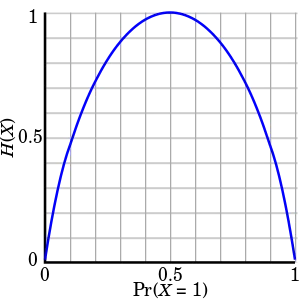
Source:Wikimedia Commons, License:CC BY-SA 3.0
The above is the plot for entropy in the case of a 2 state (binary) universe. Either the state can be ON(let us call it 1) or it can be OFF(we will represent this state as 0). The universe switches between these 2 states only. When you say Pr(X=1)=0.5, it means the probability of seeing a 1 next in the sequence is 0.5. Since total probability is 1, Pr(X=0)=Pr(X=1)=0.5, which means the uncertainty for prediction next value is the maximum. It can be a 0 or 1, with equal chance. Now I have seen people describing this concept as the maximum disorder! That is simply not correct technically. More accurately you can say that I have the least information about the system since I am unable to predict what is going to be the next state. Also, it is correct to say that maximum entropy means, the number of configurations the system can access is the most. I will explain these statements in more clear using the following toy example.
Toy Example: Let us build a boring binary universe
Let us imagine our universe again as a boring binary one. But it reveals a great concept. This universe is a box which blinks "black"(OFF / 0) or "white"(ON / 1). Think that this universe can do this 6 times. One possible trajectory of the universe is as below:
This is [0 1 1 0 0 0 ].

What are the total possibilities of trajectories our universe can take?
It is 26=64 possibilities!
The total 64 possibilities or the "ensemble" would look like below:

Now, What does Pr(X=1) corresponds to? Let us see how many sequences in this total 64, has half of them 1s. Let us count.
Let us count!
Let us count how many 1's we got:
ZERO 1s: 1 out of total 64
[0 0 0 0 0 0]
ONE 1s: 6 out of 64

TWO 1s: 15 out of 64

THREE 1s: 20 out of 64

FOUR 1s: 15 out of 64

FIVE 1s: 6 out of 64

SIX 1s: 1 out of 64
[1 1 1 1 1 1]
Let us plot the counts versus Probabilities

Now let us see this in logarithm (with base 2 for convenience):

Please note that we have not scaled the plots, but it is not really important. So What do we learned from plotting these? I will infer the following from this exercise. The Pr(X=1)=0.5 corresponds to the peak which implies the number of configurations the universe can attain is the maximum. Pr(X=1)=0.5 has the following trajectories too:


For me, these look very ordered! But still, the uncertainty in the class of trajectories when Pr(X=1)=0.5 is the most. To conclude I will visualize it as following (although it lacks rigor):

So I think you learned something interesting and new. Bye for now. I will be soon continuing my other article series! :) Take Care..
References :
[1]: Communication Systems by Simon Haykins. Look for the chapter on Information Theory.
If you like my content please upvote and resteem it. Below are few of my recent posts, you may find interesting:
- Evil genius series!: Building a crude EMG circuit
- Gradient, Divergence, and Curl: Visually Explained!
- The history and mystery of Belousov–Zhabotinsky reaction: Did it violated 2nd law of Thermodynamics?
Besides Visually Explained series, currently I am writing two more series:
- Evil genius! : My experiments with electronics and other DIY stuff!
- Classical Molecular dynamics: Focusing on teaching and setting up a molecular dynamics simulation of atomic systems.
Join #steemSTEM
Join the active science community #steemSTEM at discord: https://discord.gg/BZXkmWw

All images without image sources are my creations :)
Follow me @dexterdev
 ____ _______  ______ _________ ____ ______
/  _ /  __\  \//__ __/  __/  __/  _ /  __/ \ |\
| | \|  \  \  /  / \ |  \ |  \/| | \|  \ | | //
| |_/|  /_ /  \  | | |  /_|    | |_/|  /_| \//
\____\____/__/\\ \_/ \____\_/\_\____\____\__/